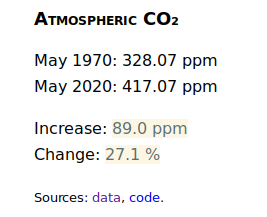
I updated Jekyll CO₂, my plugin for the web site generator Jekyll, that shows current atmospheric CO₂ data. You can see it in the right-hand bar on this site, down towards the bottom. It looks like this:
It’s showing May data because as I write that is the latest month for which data is available from the NOAA’s Earth System Research Laboratory.
It shows the current CO₂ concentration, the value fifty years ago (year range is configurable), the absolute increase and the percentage change.
I made this plugin in June 2014, at the end of my previous sabbatical, and it was text only. In October that year I updated it to use little sparklines, but over time I realized that just isn’t an effective way of visualizing this data in this context. All it ever showed was a little staircase going up bit by bit. You could hover over a step to see the number, but who’d do that?
Now it tells you the numbers right up front. Comparing to 50 years ago isn’t the best possible, but it works with the data available, and it’s a start.
The raw data is stored in Jekyll’s _data_ directory, where Jekyll sees it and groks it automatically. I don’t use data files yet, but now it’s possible, though I’m not sure how. It would be possible to indicate on every page how much the CO₂ has changed since the page was created, but you’d need to regenerate the site at least once a month to make that reasonable. (That’s the “problem” with static site generators as opposed to WordPress or Drupal, at least without using Javascript to do live content on a page.)
(There’s one improvement needed: fail gracefully if the NOAA’s web site is unavailable. This happens when there’s a government shutdown in the States because they haven’t passed a budget. Mind-boggling.)
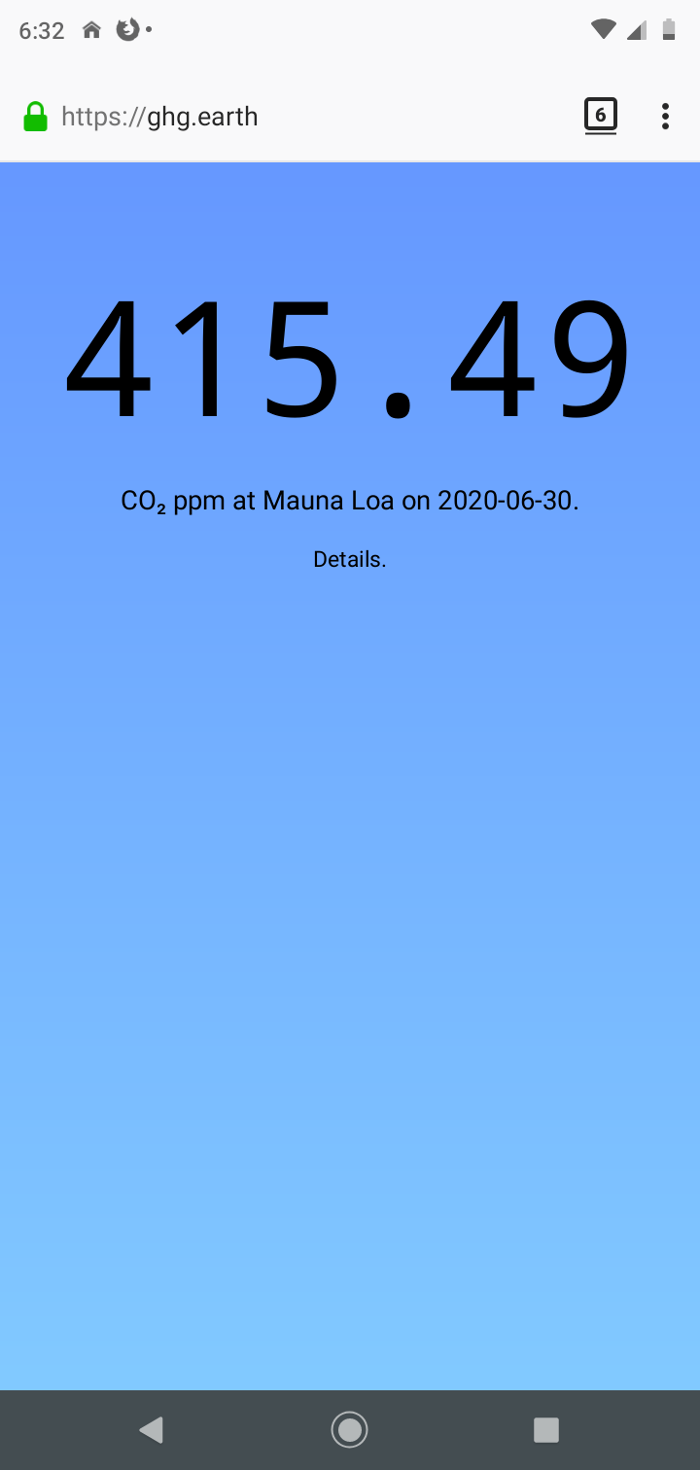
See also GHG.EARTH, which is right up to date.