Here’s how I fixed a problem in R where charts showing counts over time didn’t look right because R wasn’t taking zeroes into account.
This is related to Kieran Healy’s Zero Counts in dplyr but I got the real fix from Kan Nishida’s Populating Missing Dates with Complete and Fill Functions in R and Exploratory, and I’m documenting it here for my own sake and to show it in pure R because I don’t use Exploratory.
Let’s say I have a data set that shows counts of something or other—let’s say sales of fountain pens—on various days through the year. The thing is, people don’t buy fountain pens every day, and we only know about days when they do sell them, so when we make a data frame, it only has some of the days in the year.
Fake it this way:
> library(tidyverse)
> dates <- seq(as.Date("2019-01-01"), as.Date("2019-12-31"), by = "day") %>% sample(20) %>% sort()
> counts <- counts <- sample(1:10, 20, replace = T)
> d <- tibble(date = dates, count = counts)
> d
# A tibble: 20 x 2
   date       count
   <date>     <int>
 1 2019-01-05     6
 2 2019-01-08    10
 3 2019-01-16     7
 4 2019-01-26     5
 5 2019-02-03     7
 6 2019-04-03     7
 7 2019-04-08     1
 8 2019-04-11     4
 9 2019-04-18     1
10 2019-04-20     9
11 2019-05-16     9
12 2019-05-27     1
13 2019-05-31     5
14 2019-07-08     9
15 2019-07-13     2
16 2019-09-16     1
17 2019-10-13     2
18 2019-10-30     9
19 2019-12-02     5
20 2019-12-19     4
(As with all code I write, I assume there’s a better way to do it, but what I have works, so it’s good enough for now.)
So d has our data and we want to chart it.
> ggplot(d, aes(x = date, y = count)) + geom_line()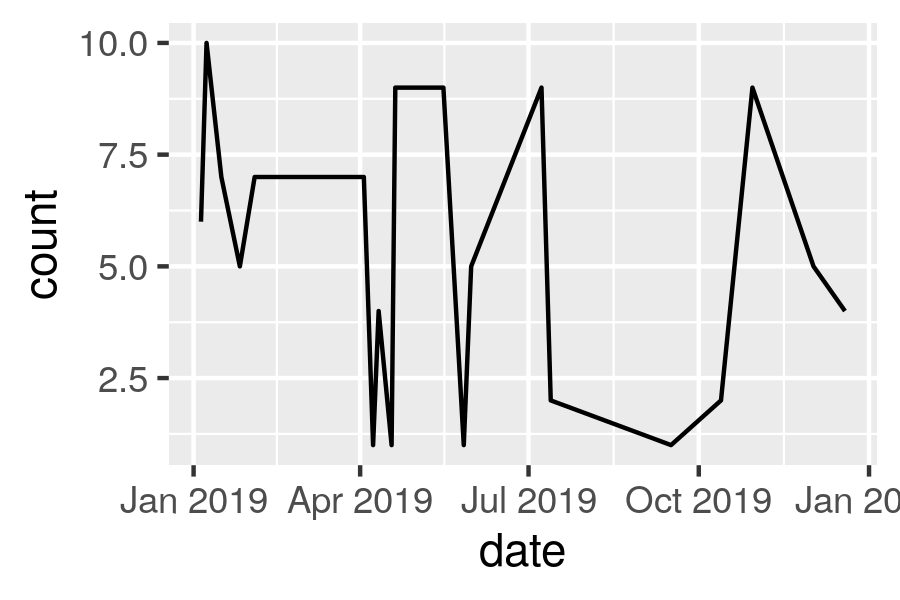
That’s not right. It’s joining up all the points, but what about all the days when 0 fountain pens were sold? They don’t show at all. The line never goes to 0. This is no good. Does geom_step work?
> ggplot(d, aes(x = date, y = count)) + geom_step()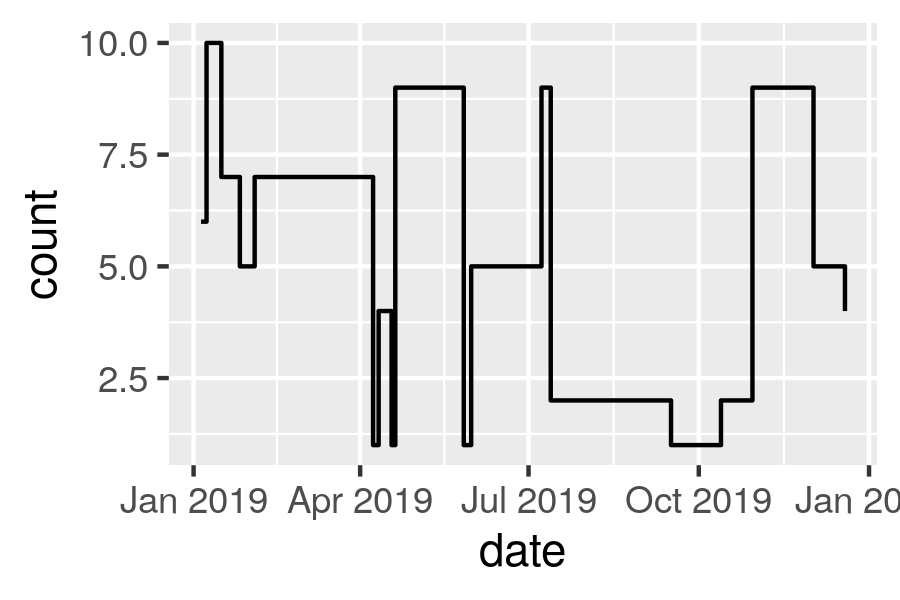
No. It’s carrying the y value (count) along until there’s a new one to show, then it goes up or down. That’s no good because it never hits 0 either.
Now, in real life I’m making these numbers using count, and according to the documentation it looks like setting .drop = FALSE should fill in the zero values for the dates, but it didn’t, either because the data was set up the wrong way or I was doing it wrong. In any case, here’s how I got it to work. I complete all the dates and then convert all the NAs (which are used to fill up count) with 0s.
> d <- d %>% complete(date = seq.Date(min(date), max(date), by = "day")) %>% mutate(count = ifelse(is.na(count), 0, count))
> d
# A tibble: 349 x 2
date count
<date> <dbl>
1 2019-01-05 6
2 2019-01-06 0
3 2019-01-07 0
4 2019-01-08 10
5 2019-01-09 0
6 2019-01-10 0
7 2019-01-11 0
8 2019-01-12 0
9 2019-01-13 0
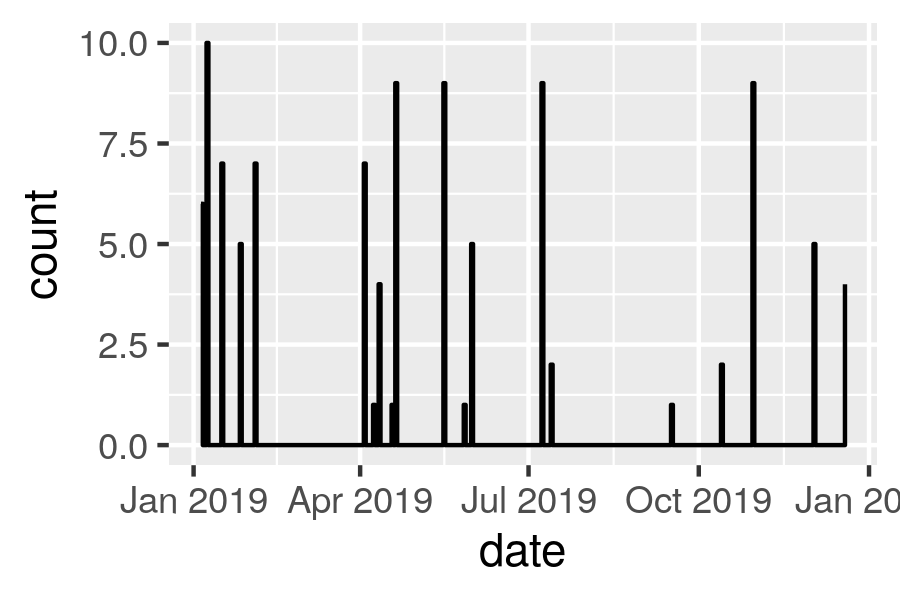
10 2019-01-14 0And now it works and the line hits 0 on the days when no fountain pens were sold.
> ggplot(d, aes(x = date, y = count)) + geom_step()