I’m a regular listener of the Canadaland show, run by Jesse Brown (@jessebrown). I liked it from the first seconds of the first show, an interview of Michael Enright, who’s worked at CBC Radio for decades and was Brown’s boss for a while:
Enright: So what are we doing?
Brown: It’s a podcast. It’s kind of like your radio show, except people listen to it on purpose.
Enright: OK. Good. You’ve put on weight.
Episode 20 of the show, a few months back, was Rex Murphy is Paid by the Oil Sands and the CBC Won’t Disclose or Discuss It. Now, Rex Murphy is a blowhard who appears on the CBC news every week offering some eminently ignorable opinion about something. I stopped paying attention to him a long time ago after he spent five minutes explaining, with his tedious sesquipedalian loquaciousness, how he was tired of Britney Spears.
Any road up, turns out Murphy was taking money from Big Oil to talk at their events and then he was getting on CBC TV and saying the tar sands are a good thing, and he never mentioned he’d taken the money.

It all blew up into a bit of a storm, and the CBC did not behave properly, but one outcome is that a listing of public appearances by CBC staff appeared on their web site a little while ago. I think I saw Jesse (I hope he won’t mind if I call him Jesse, he seems familiar, I’ve been listening to his podcasts for so long) mention it on Twitter.
Because I run some privacy extensions on my browser (especially Disconnect), the page didn’t work for me because it was trying to load in content from a Google Docs spreadsheet. I had a look and saw it was trying to pull in the News & Local data in JSON. The same data is also available in XML.
You can see it nicely on the command line with
curl "https://spreadsheets.google.com/feeds/list/11Kk-vaj_MKGZdImP54YEh-KxhUMjzDINtZLohfnvbLU/266229600/public/values" | xmllint --format -`
There’s a lot in the file, but here’s what’s most interesting:
  <entry>
    <id>https://spreadsheets.google.com/feeds/list/11Kk-vaj_MKGZdImP54YEh-KxhUMjzDINtZLohfnvbLU/266229600/public/values/cokwr</id>
    <updated>2014-06-06T14:37:05.063Z</updated>
    <category scheme="http://schemas.google.com/spreadsheets/2006" term="http://schemas.google.com/spreadsheets/2006#list"/>
    <title type="text">Adrian Harewood</title>
    <content type="text">date: 4/24/2014, event: Don't Quit your Day Job Fundraiser, role: Host, fee: Unpaid</content>
    <link rel="self" type="application/atom+xml" href="https://spreadsheets.google.com/feeds/list/11Kk-vaj_MKGZdImP54YEh-KxhUMjzDINtZLohfnvbLU/266229600/public/values/cokwr"/>
    <gsx:name>Adrian Harewood</gsx:name>
    <gsx:date>4/24/2014</gsx:date>
    <gsx:event>Don't Quit your Day Job Fundraiser</gsx:event>
    <gsx:role>Host</gsx:role>
    <gsx:fee>Unpaid</gsx:fee>
  </entry>
In each entry, there’s some stuff we don’t need to bother with, but these fields look good for an initial analysis: name, date, event, role, fee. Fee is either “Paid” or “Unpaid,” it doesn’t say how much was paid.
  <entry>
    <gsx:name>Adrian Harewood</gsx:name>
    <gsx:date>4/24/2014</gsx:date>
    <gsx:event>Don't Quit your Day Job Fundraiser</gsx:event>
    <gsx:role>Host</gsx:role>
    <gsx:fee>Unpaid</gsx:fee>
  </entry>
That’s not all the data, though. There’s also the Network Radio tab. The April data in XML is available. (The April and May URLs are different; I don’t see immediately how they’re structured so I don’t know how to get at all the data in one go when there’s more than one month’s information available. This first stab at it does use all the available data, though.)
I decided to load this into R to see what I could make of it. You can load the data up into your favourite data tool or language. Have a go! Here I slurp up the XML, convert it into data frames, pick out the rows with actual data, and glom them together into one data frame, appearances.
> library(XML)
> library(RCurl)
> xml.news.file <- "https://spreadsheets.google.com/feeds/list/11Kk-vaj_MKGZdImP54YEh-KxhUMjzDINtZLohfnvbLU/266229600/public/values"
> xml.radio.file <- "https://spreadsheets.google.com/feeds/list/1qqXnT1--bKn2qXigFqoaH09T9vBm4dXlQNQgTjS60tE/266229600/public/values"
> news.appearances.xml <- xmlParse(getURL(xml.news.file), useInternalNodes = TRUE)
> radio.appearances.xml <- xmlParse(getURL(xml.radio.file), useInternalNodes = TRUE)
> news.appearances.df <- xmlToDataFrame(news.appearances.xml)
> radio.appearances.df <- xmlToDataFrame(radio.appearances.xml)
> appearances <- rbind(news.appearances.df, radio.appearances.df)
> appearances <- subset(appearances, !is.na(event), select=c("name", "event", "date", "role", "fee"))
> appearances$date <- as.Date(appearances$date, format = "%m/%d/%Y")
> head(appearances)
> head(appearances)
               name                                                               event       date   role    fee
12  Adrian Harewood                                  Don't Quit your Day Job Fundraiser 2014-04-24   Host Unpaid
13   Heather Hiscox                 Canadian Medical Hall of Fame 20th Anniversary Gala 2014-04-24   Host   Paid
14 Peter Mansbridge Canadian Centre for Male Survivors of Child Sexual Abuse Fundrasier 2014-04-25 Speech Unpaid
15       David Gray Canadian Centre for Male Survivors of Child Sexual Abuse Fundrasier 2014-04-25   Host Unpaid
16      Miyoung Lee                                RBC Top 25 Canadian Immigrant Awards 2014-04-25   Host Unpaid
17       Nil Köksal                              9th Annual Women Against MS Gala Lunch 2014-04-25   Host Unpaid
OK, we’ve got a data frame that’s got all the information we need in it. What’s the extent of the dates?
> min(appearances$date)
[1] "2014-04-24"
> max(appearances$date)
[1] "2014-04-30"
Only a week’s worth of data so far, and they’re a month behind. Well, here’s hoping they keep it up. It’s a great step, making this data public, and I hope they’re committed to it.
Let’s simplify what we have and make some counts. First, totals of paid and unpaid events.
> library(dplyr)
> library(ggplot2)
> total <- appearances %.% group_by(name, fee) %.% summarise(count = n()) %.% arrange(desc(count))
> total
Source: local data frame [26 x 3]
Groups: name

               name    fee count
1   Adrian Harewood Unpaid     4
2     Brian Goldman   Paid     2
3      Craig Norris Unpaid     2
4    Heather Hiscox   Paid     2
5     Laurence Wall Unpaid     2
6       Miyoung Lee Unpaid     2
7       Sandra Abma Unpaid     2
8      Bob McDonald   Paid     1
9      Bob McDonald Unpaid     1
10       David Gray Unpaid     1
11      Debra Arbec Unpaid     1
12  Dwight Drummond Unpaid     1
13     Evan Soloman Unpaid     1
14    Jian Ghomeshi   Paid     1
15        Jim Brown Unpaid     1
16   Natalie Clancy Unpaid     1
17       Nil Köksal Unpaid     1
18       Nora Young   Paid     1
19       Nora Young Unpaid     1
20 Peter Mansbridge   Paid     1
21 Peter Mansbridge Unpaid     1
22       Rex Murphy   Paid     1
23       Rick Cluff Unpaid     1
24   Sonali Karnick Unpaid     1
25        Waub Rice Unpaid     1
26     Wendy Mesley   Paid     1
Adrian Harewood had four engagements that week, setting the record for busiest person. Most people had one. And most were unpaid. How many?
> appearances %.% group_by(fee) %.% summarise(count = n())
Source: local data frame [2 x 2]

     fee count
1   Paid    10
2 Unpaid    25
10 paid, 25 unpaid, that’s 35 total, so 29% were paid and 71% unpaid in this small data set. Worth watching.
We can make a basic chart of paid and unpaid appearances.
> ggplot(total, aes(x = name, y = count, fill = fee)) + geom_bar(stat = "identity") + theme(axis.text.x = element_text(angle = 90))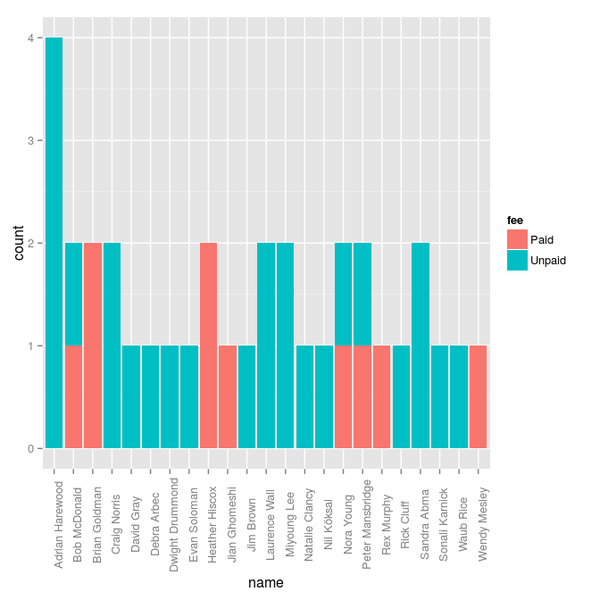
That could definitely do with some tidying. But for now, let’s just pick out who’s been getting paid.
> appearances %.% filter(fee == "Paid")
               name                                                              event       date      role  fee
1    Heather Hiscox                Canadian Medical Hall of Fame 20th Anniversary Gala 2014-04-24      Host Paid
2    Heather Hiscox                     Canadian Tourism Commission Rendez Vous Canada 2014-04-28      Host Paid
3      Wendy Mesley                Workplace Safety and Prevention Services Conference 2014-04-29 Moderator Paid
4  Peter Mansbridge                          Halifax Chamber of Commerce Spring Dinner 2014-04-30    Speech Paid
5        Nora Young                                                   Sheridan College 2014-04-25    Speech Paid
6     Brian Goldman                      Mohawk College: Apps for Health and Education 2014-04-25    Speech Paid
7      Bob McDonald                                            Toronto Law Association 2014-04-26    Speech Paid
8        Rex Murphy Association of Professional Engineers and Geoscientists of Alberta 2014-04-26    Speech Paid
9     Jian Ghomeshi                                          Amazon First Novel Awards 2014-04-30      Host Paid
10    Brian Goldman                                          Orillia Soldiers Mem Hosp 2014-04-30    Speech Paid
Peter Mansbridge’s paid event was to speak at the Halifax Chamber of Commerce spring dinner (“Peter Mansbridge stands at such a level of public respect and visibility that, for many Canadians, he is not simply a newscaster: he is the daily voice of a nation”). I couldn’t begin to guess at how much he got paid for that, or how much people paid to attend, but I could begin to guess at how much you’d have to pay me to go. Jian Ghomeshi got paid to host the Amazon.ca First Novel Award, which seems like a good pairing.
Let’s narrow it down to just counts of who’s been paid to speak:
> paid <- appearances %.% filter(fee == "Paid")  %.% group_by(name) %.% summarise(count = n())
> paid
Source: local data frame [8 x 2]

              name count
1     Bob McDonald     1
2    Brian Goldman     2
3   Heather Hiscox     2
4    Jian Ghomeshi     1
5       Nora Young     1
6 Peter Mansbridge     1
7       Rex Murphy     1
8     Wendy Mesley     1
> ggplot(paid, aes(x = name, y = count)) + geom_bar(stat = "identity") + theme(axis.text.x = element_text(angle = 90))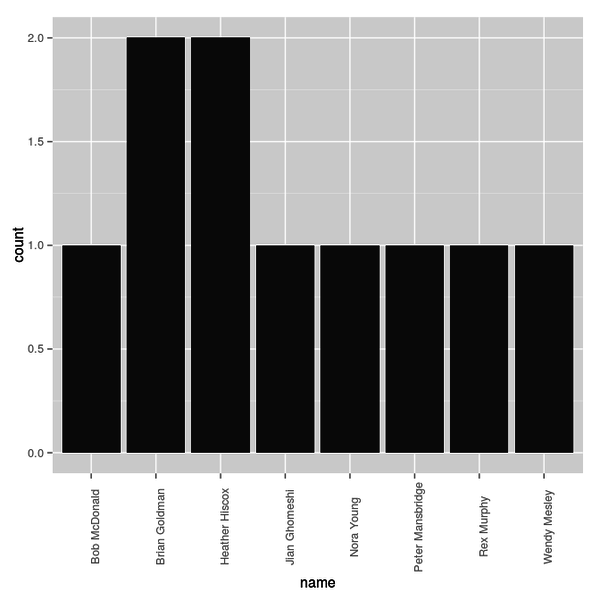
A dull chart, but as those spreadsheets grow, it could get more interesting. Analysis of where people are speaking, and who their audiences are, will also be interesting. And of course, what if any effect this has on their reporting, and if they disclose their paid work.
This is just a first stab at the initial small data set, but with the CBC making the information easily available, anyone can hack on this. It will be interesting to watch. Congratulations to the CBC for opening this up.