Back in September 2012, when Firefox was at version 15 and Emacs at version 24.2, I asked When will Firefox overtake Emacs?
I used R (all the code is included in the post) to generate this chart:
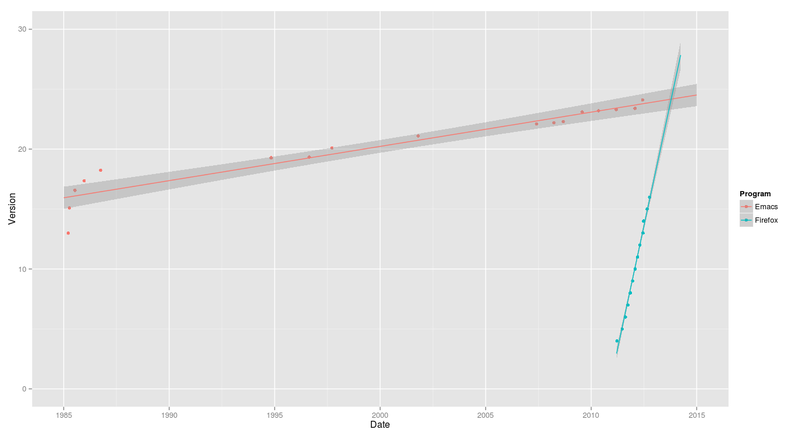
I said, “I don’t know how to extract the range where the lines collide, but it looks like in late 2013 Firefox will overtake Emacs with a version number at or under 25.”
Let’s see how it turned out by looking at current data. Firefox is at 26 now, and Emacs at 24.3.
> library(ggplot2)
> programs <- read.csv("http://www.miskatonic.org/files/se-program-versions-2.csv")
> programs$Date <- as.Date(programs$Date, format="%B %d, %Y")
> head(programs)
  Program Version       Date
1   Emacs    24.3 2013-03-10
2   Emacs    24.2 2012-08-27
3   Emacs    24.1 2012-06-10
4   Emacs    23.4 2012-01-29
5   Emacs    23.3 2011-03-10
6   Emacs    23.2 2010-05-08
> ggplot(programs, aes(y = Version, x = Date, colour = Program)) + geom_point() + geom_smooth(span = 0.5, fill = NA)
Here we see Firefox higher on the y-axis, because of its higher version number:
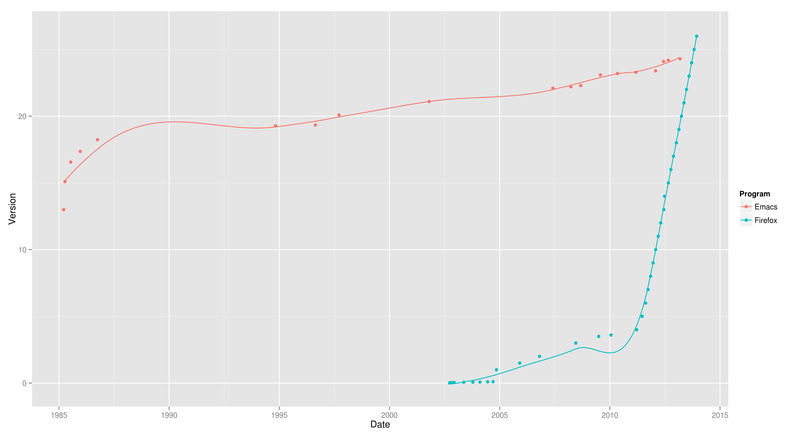
Now we add regression predicting the future of Emacs:
> ggplot(programs, aes(y = Version, x = Date, colour = Program)) + geom_point() + geom_smooth(span = 0.5, fill = NA)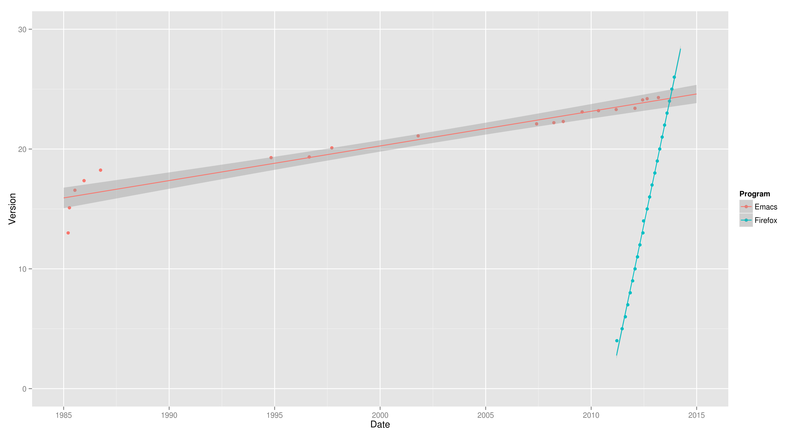
Firefox’s straight line on the right really shows its steady schedule of a new release every six weeks.
Let’s close in on just 2013:
> ggplot(subset(programs, !(Program == "Firefox" & Version < 4)), aes(y = Version, x = Date, colour = Program)) + geom_point() + ylim(0,30) + xlim(as.Date("2013-01-01"), as.Date("2014-01-01")) + stat_smooth(method = lm, fullrange = TRUE)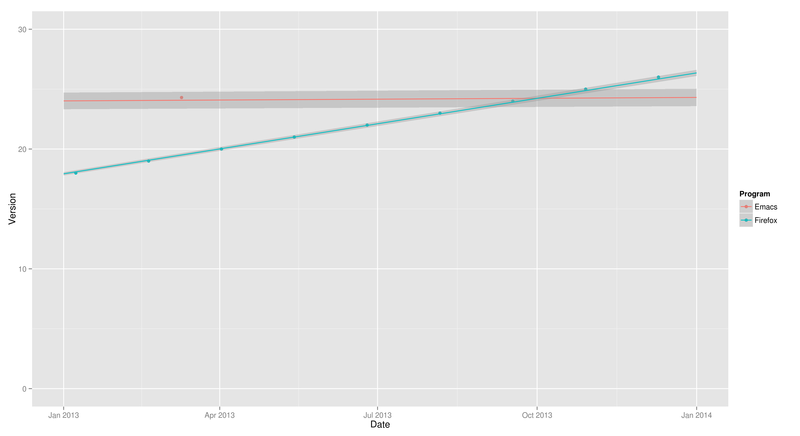
So it did happen in late 2013 (in October), and the version number was just over 24. R’s predictions were correct on both counts!
I still don’t know how to solve the system of the two equations to find where they cross, but hey, I’m enjoying Jekyll so much I couldn’t wait to post.