About a month ago I was at Great Lakes THAT Camp 2012 (staying in a former convent) and I made a graph of tweeting action and posted about it at #thatcamp hashtags the Tony Hirst way.
The last couple of days I was at Code4Lib North 2012 (staying in a former convent) and on the train back home I made a graph of tweeting action, this time using ggplot2 in R the way Tony Hirst had. This should let you recreate it:
> require(ggplot2)
> require(twitteR)
> require(plyr)
> tweets <- searchTwitter("#c4ln", n=500)
> tw <- twListToDF(tweets) # turn results into a data frame
> tw1 <- ddply(tw, .var = "screenName", .fun = function(x) {return(subset(x, created %in% min(created),select=c(screenName,created)))})
> tw2 <- arrange(tw1, -desc(created))
> tw$screenName <- factor(tw$screenName, levels = tw2$screenName)
> library(stringr)
> trim <- function (x) sub('@','',x)
> tw$rt=sapply(tw$text,function(tweet) trim(str_match(tweet,"^RT (@[[:alnum:]_]*)")[2]))
> tw$rtt=sapply(tw$rt,function(rt) if (is.na(rt)) 'T' else 'RT')
> png(filename = "20120525-c4ln-tweets.png", height=800, width=600)
> ggplot(tw)+geom_point(aes(x=created,y=screenName,col=rtt))
> dev.off()
(If you don't have the twitteR (or ggplot2 or plyr) package installed then run install.packages("twitteR") (or the other package name) to get it.)
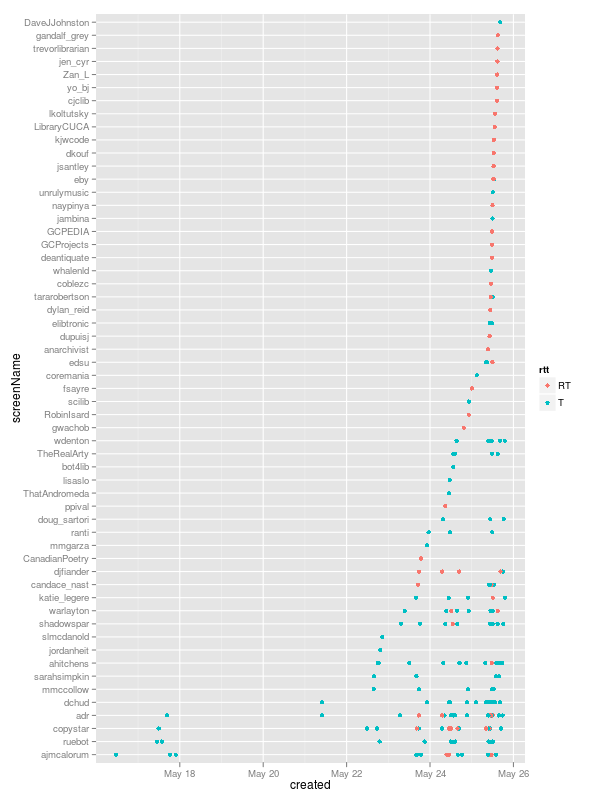
What does this show us? Original tweets and old-style RT retweets, first off. That a few people started using the hash tag early(@ajmcalorum was first off the bat). That a few people used it a lot (the usernames, lower down, with a lot of dots along their horizontal line) and more people used it only once (usually retweets). That there were a number of tweets on 23 May (the day before, when people were travelling to Windsor to get there), but things started in earnest on the first day, 24 May.